Strategic Cost Assessment
Pim VijftigschildCCO at New Black

iOS versus Android in Enterprise Retail
When you’re leading a global brand, quick assumptions about cost can lead you astray. In enterprise retail technology - specifically modern POS (point-of-sale) systems - there’s a persistent belief that Android solutions are inherently cost-effective, while Apple’s iOS-based solutions appear expensive by comparison. This perception, though widespread, deserves a closer, fact-based look.
The real strategic question isn’t about the upfront cost; it’s about the long-term impact of technology choices on your business. Total Cost of Ownership (TCO), which incorporates maintenance, security, compliance risks, employee productivity, hardware lifecycle, environmental sustainability and the costs of phasing out software, tells a very different story than sticker price alone.
Industry reports from Gartner, IDC, and Forrester — along with enterprise case studies — show a consistent pattern. Android has made strong progress in recent years, especially in affordability, device variety, and flexibility. However, when looking at total cost of ownership (TCO), iOS typically proves to be more cost-effective in the long run. It tends to offer better security, smoother operations, and lower ongoing costs — even though the upfront price is higher. Despite these measurable benefits, Apple has often struggled to communicate them clearly to enterprise decision-makers.
“Sticker prices don’t reflect true operational costs, Total Cost of Ownership reveals the full story.”
For C-level retail executives (CIOs, CFOs, CISOs, Heads of Retail), the evidence is clear that investing in Apple’s ecosystem is a “smart money” decision. The following sections provide an in-depth exploration of the market context, cost analysis, security, case studies, and actionable recommendations to support this thesis. In an era of unified commerce and digital acceleration, aligning with Apple’s platform is a strategic move to maximize value and stay ahead of the technology curve.
Industry reports from Gartner, IDC, and Forrester — along with enterprise case studies — show a consistent pattern. Android has made strong progress in recent years, especially in affordability, device variety, and flexibility. However, when looking at total cost of ownership (TCO), iOS typically proves to be more cost-effective in the long run. It tends to offer better security, smoother operations, and lower ongoing costs — even though the upfront price is higher. Despite these measurable benefits, Apple has often struggled to communicate them clearly to enterprise decision-makers.
This whitepaper cuts through common misperceptions by providing clear, evidence-based insights into the actual financial, operational, and strategic impacts of POS technology decisions. Rather than advocating for one platform, our goal is to empower enterprise leaders with objective data, enabling informed and strategically sound choices.
Executive Summary
Retail technology decisions have long been influenced by the actual lower upfront cost of Android-based POS systems, which are genuinely cheaper to purchase than their iOS counterparts. However, for enterprise retailers, focusing solely on initial savings can obscure the fullstrategic picture.
This whitepaper objectively examines the real Total Cost of Ownership (TCO) of POS technology, comparing Android and iOS platforms across measurable, strategic dimensions such as long-term financial impact, device reliability, security and compliance risks, employee experience, and sustainability.
Drawing on authoritative insights from Gartner, IDC, IBM, and real-world case studies from leading global brands, this analysis provides enterprise decision-makers with clear data revealing that:

TCO Comparison
Despite higher initial prices, iOS-based systems consistently show significantly lower total operational costs over time.

Security and Compliance
Android systems face substantially higher security vulnerabilities and compliance risks, primarily due to fragmented OS updates and higher malware exposure.

Sustainability
iOS-based solutions offer measurable advantages in energy efficiency, device longevity, and lower environmental impact.

Employee Experience
Retailers deploying iOS devices report significant gains in productivity, employee satisfaction, and faster onboarding.
TCO Comparison
Behind the Numbers
Strategic decisions at C-level require cutting through perceptions to uncover genuine cost-drivers. Total Cost of Ownership (TCO) shifts the conversation beyond upfront investment, providing clarity on long-term financial impact. Here’s what detailed industry research reveals:
Device Failure Rates
According to IBM Enterprise Fleet Reports (2023), Android devices experience annual failure rates between 12% and 18%, compared to 3% for iOS devices. These higher failure rates directly increase downtime, operational disruptions, and replacement costs, significantly impacting long-term financial planning.
iOS
3%
Android
12-18%
Support and Maintenance Costs
While Android’s upfront affordability and expanding ecosystem make it an attractive option, IDC’s 2023 field research and Forrester’s analyses reveal important operational realities. The Android landscape is inherently diverse - with varied patch cycles, OEM-specific MDM implementations, and inconsistencies in hardware quality and lifecycle. This fragmentation doesn’t diminish Android’s potential, but it does introduce complexity. For enterprises, that complexity translates into support costs that can be up to 80% higher compared to the streamlined consistency of Apple’s iOS ecosystem.
“Longer hardware lifecycles (4–5Y iOS vs. 2–3Y Android) significantly reduce electronic waste and environmental impact.”
Residual Value
iOS
$330
Android
$80
“ Clear, measurable data replaces perception with strategic clarity.”
Total Cost of Ownership Comparison / 4-year lifecycle, per device
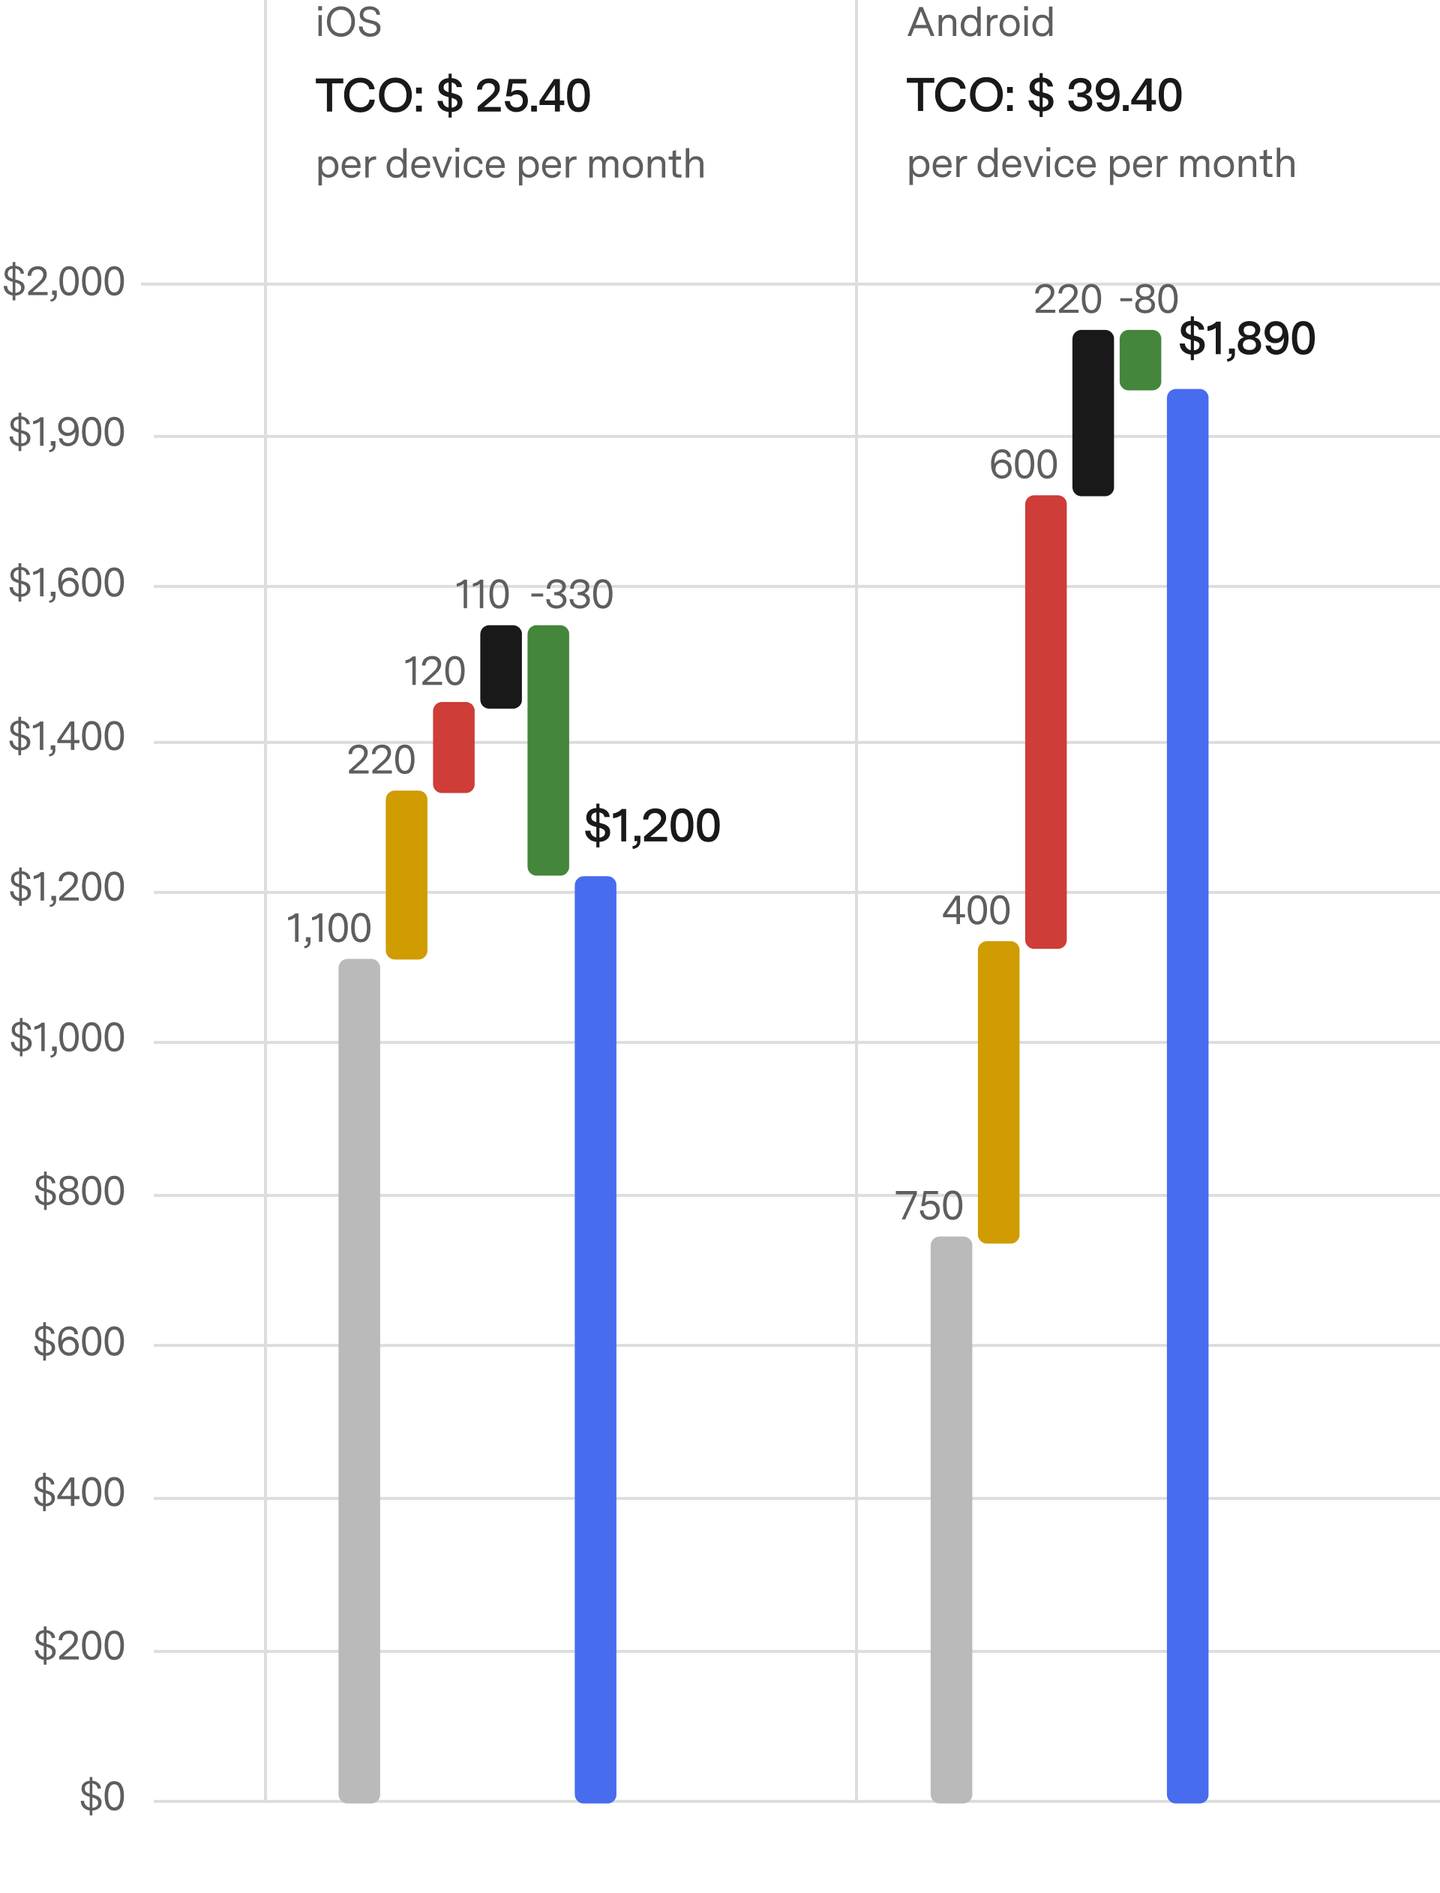

Initial Purchase Cost
Android devices generally have lower upfront costs, while iOS devices typically have higher initial pricing.

Maintenance Costs
Android incurs approximately 80% higher maintenance costs due to device fragmentation and varying update cycles (IDC, 2023).

Downtime Costs (productivity loss & support)
Higher failure rates in Android devices (12–18% annually) compared to iOS (3%) significantly increase downtime- related productivity losses and support costs (IBM Fleet Reports, 2023).

Replacement Costs
Higher failure rates lead to increased replacement requirements for Android devices.

Residual Value
iOS devices retain significantly higher 750 residual values compared to Android (ZDNet, 2023), which substantially reduces long-term TCO.

Total Cost of Ownership
4-year lifecycle, per device
Taken together, these measurable insights offer a more complete view of the financial landscape. While Android devices often require a lower initial investment, long-term ownership may involve higher operational complexity - including more frequent device replacements, increased maintenance efforts, and lower residual value. Strategic technology decisions benefit from looking beyond short-term savings to consider total cost of ownership, long-term consistency, and supportability - especially at scale.
Methodology Note: All total cost of ownership calculations in this report are based on the average purchase prices of a selection of Android smartphones and iPhones that are suitable for enterprise POS use. Devices were chosen across multiple countries and continents to reflect international price variations and market availability. The averages represent a realistic cross-section of devices typically deployed in global retail environments.
Security and Compliance
A Strategic Assessment of Risk
Security and compliance are strategic pillars underpinning enterprise retail’s long-term success. Effective risk management requires clear, objective insights into how technology platforms differ in security architecture and compliance capabilities. Below, we present a detailed, fact-based comparison between Android and iOS ecosystems, drawing from analyses by Gartner, IDC, and Forrester.
Platform Security Comparison: iOS v.s. Android
iOS (Apple) | Android | |
|---|---|---|
OS Update Timeliness | Day-zero OS updates; no OEM delays | OEM-dependent, fragmented patch cycles |
Device Encryption | Consistent, hardware-backed encryption | Encryption by default, hardware varies by OEM |
Application Security (Sandboxing) | Universal app sandboxing on all devices | App sandboxing standard, implementation may vary |
Mobile Device Management (MDM) | Unified MDM support, minimal variation | Android Enterprise support, OEM differences possible |
Data Privacy Model | Privacy-first architecture, no data monetization | OEM-dependent models, some data monetization risk |
Forrester Wave™ for Endpoint Security (2023) specifically ranks Apple’s integrated security model as the most enterprise-ready among mobile platforms. Gartner’s data reinforces this perspective, highlighting measurable security differences.
OS Update Fragmentation
Nearly half (48%) of enterprise Android devices operate on outdated or unsupported OS versions, significantly increasing compliance risks such as GDPR and PCI-DSS violations. In comparison, fewer than 5% of enterprise iOS devices run outdated OS versions.
Outdated or Unsupported OS Versions
iOS
5%
Android
48%
Malware Exposure
Gartner’s Mobile Security Report (2023) states that Android devices account for 98% of mobile malware incidents, while iOS devices experience less than 2%.
Malware Incidents
iOS
<2%
Android
98%
Practical Strategic Implications
These measurable differences directly impact enterprise retail businesses:
Operational Overhead
Fragmentation and potential security breaches translate into higher complexity, increased IT management efforts, and elevated support costs.
Compliance and Regulatory Risk
Security vulnerabilities and outdated systems heighten the risk of data breaches, potentially leading to substantial regulatory fines and lasting reputational damage.
Brand Reputation and Customer Trust
Security incidents directly threaten customer confidence, affecting brand reputation and long-term profitability.
Employee Experience and Operational Efficiency
The Human Factor in Tech Decisions
Strategic technology decisions in retail aren’t solely financial or technical - they deeply affect employee productivity, experience, and operational efficiency. Clear, measurable differences exist between technology choices, particularly regarding employee enablement, onboarding efficiency, and daily productivity.
Employee Enablement & Experience - Measurable Results
According to an internal study by Rituals Cosmetics (2023), deploying iOS-based POS solutions has shown significant operational improvements, including:
Employee satisfaction increased by 38%
After switching to an iOS-native POS system.
Onboarding time reduced by 50
Net Promoter Score (NPS) from 4.7 to 8.9 out of 10
For employee-facing tools.
Store-level conversion rates increased by 24%
Helpdesk tickets decreased by 41%
Due to improved reliability and ease of use.
As the results above indicate, consistency and responsiveness in device performance play a key role in reducing helpdesk load, improving satisfaction, and enabling more service and customer interactions.
“Employee onboarding time is reduced by roughly 50% with intuitive technology, cutting training costs by up to $1.65 million annually.”
Operational Gains - Quantifiable Impact
A practical benchmark from global retailer Kiko (2023) further illustrates measurable operational gains:
Onboarding Speed
iOS
15 days
Android
30 days
This represents a roughly 50% reduction, translating directly to approximately $1.65 million in annual operational savings.
Native iOS vs. Cross-Platform Solutions
Technical and Financial Snapshot
Clear technical and financial differences exist between native iOS (SwiftUI) and cross-platform (React Native) solutions, significantly influencing operational outcomes.
TCO and ROI - Practical Strategic Outcomes
According to IBM’s Mac@IBM initiative (extended to iOS), each Apple device saves approximately $600–$700 in support costs over its lifecycle. Applied to enterprise retail, these savings translate into:
About 35% lower Total Cost of Ownership (TCO)
Over a typical four-year device lifecycle.
Fewer replacements, fewer disruptions
And significantly faster customer checkout processes.
A clear financial breakeven point reached within 12–18 months
After which Apple devices start generating cumulative operational savings.
Native iOS vs. Cross-Platform Solutions
Native iOS (SwiftUI) | Cross-platform (React Native) | |
|---|---|---|
Device lifespan | 4–5 years | 2–3 years |
Support cost (over 4 years) | ~$330 |
|
Break-fix incident rate | ~3% per year | ~12–18% per year |
Resale value (after 4 years) | ~30% | ~9% |
Malware exposure | <2% | ~98% |
Employee onboarding time | 13-17 days | 28-32 days |
Support tickets per user | ~1.2 per year | ~2.3 per year |
Security patch latency | 0 days | 30–90 days |
Native iOS development consistently outperforms cross-platform alternatives in critical operational metrics including performance, reliability, onboarding efficiency, ongoing support costs, and offline reliability.
“Native solutions provide immediate access to full OS features, optimal performance, and faster updates, ensuring smoother retail operations.”
Strategic Implications
Technology choices shape daily employee experiences, influencing operational efficiency, customer interaction quality, and overall business results. Strategic leaders must explicitly consider employee enablement, measurable productivity gains, technical reliability, and clear ROI timelines as key decision factors - not just upfront costs or technology trends.
Strategic Conclusions and Recommendations
Effective strategic leadership in enterprise retail means looking beyond upfront costs and assumptions. The data presented here highlights several clear insights:
Total Cost of Ownership
Initial perceptions about device costs require reconsideration. Despite lower upfront prices, Android’s significantly higher operational costs, shorter device lifecycles, and lower residual values position iOS-based solutions as a more predictable long-term investment.
Sustainability and Environmental Impact
Technology choices have clear, measurable effects on energy consumption and sustainability. The documented energy savings (Estée Lauder, 2023) and longer device lifecycles directly support enterprise-level ESG commitments.
Security and Compliance
Security risks are measurable and differ substantially by platform. Gartner’s data shows clear security and compliance advantages in iOS environments, with significantly lower malware exposure and better-managed OS update cycles, reducing compliance risks.

Recommended Strategic Approach
Strategic decisions regarding retail technology should be guided by clear, measurable evidence. While initial costs and perceptions matter, data-driven analysis of total ownership costs, operational security, employee efficiency, and sustainability provides deeper insight for long-term strategic planning.
Employee Experience and Productivity
Real-world operational benchmarks, including cases from global retailers such as Kiko and Rituals Cosmetics, demonstrate significant productivity gains and improved employee satisfaction when deploying intuitive, reliable POS technology.
References
- IBM. (2023). Enterprise Fleet Reports 2023.
- IDC. (2023). Worldwide Smartphone Market Shares, 2023: IDC Report.
- SellCell. (2023). Smartphone Depreciation Report 2023.
- Gartner. (2023). Mobile Threat Defense Market Reviews.
- Forrester. (2023). The Forrester Wave™: Endpoint Security, Q4 2023.
- IMD Business School. (2023). Rituals Cosmetics: Building the World’s Leading Well-being Brand in Asia.
- FFNews. (2023). KIKO Milano and Adyen: The Future of Beauty Passes Through Innovation and Effective Payments.
- Estée Lauder Companies. (2023). Social Impact and Sustainability Report 2024.
The article was published on June 3, 2025
Contact Information: info@newblack.io
Don't miss these

From FrankenStack to Customer-Centricity
See how enterprise leaders can reduce complexity, improve agility, and accelerate customer-centric growth by moving from fragmented systems to unified commerce.

Designing Retail IT Architecture for Agility
Enable enterprise growth with a retail IT architecture built for agility, scalability, and faster decision-making across retail.

From Touchpoints to Increased Transactions
Turn every customer touchpoint into measurable business impact with a unified commerce approach that drives conversion, growth, and long-term value.